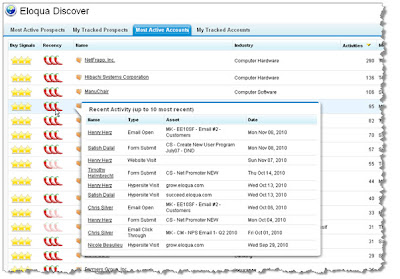
As you may know, we recently launched a new sales tool called Eloqua Discover for Salesforce.com. This application, written entirely on the Force.com platform, provides sales reps both individual and account-level activity insights paired with flexible tracking tools so that they are able to understand which prospects they should be engaging, with what content they should be engaging them and when engagement would be most effective.
But the question comes up:
How can management and executives get the same information? What about the management and executive level folks that do not directly own or engage all sales opportunities but want to leverage the insights provided by Discover to keep track of general activity within territories and understand who the hottest accounts are?
Because of the way Eloqua Discover for Salesforce.com is designed, you can easily generate rollup activity reports right in Salesforce.com based on rep & region and know exactly which Accounts in which regions are most likely to buy. Here’s what it can look like:
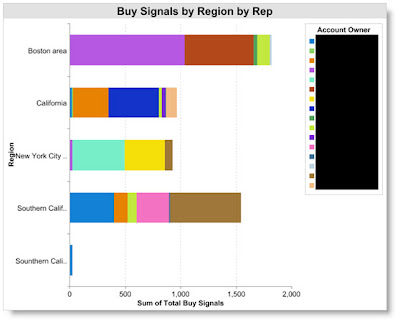
The graph below illustrates which regions have the greatest purchase interest at the Account level, broken down by which reps own those Accounts
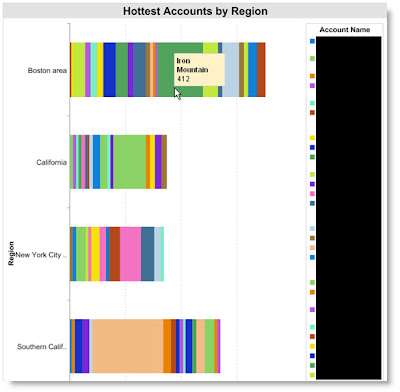
The graph below illustrates which Accounts are showing the most buying interest, by region. Hovers allow you to quickly see exactly which Accounts are exhibiting the highest engagement
How do you do this? It’s actually pretty straight forward.
In short, you just make a report in SFDC that references a few extra fields that Discover has added to your Account object. You could also do it based on fields added to the Contact and Lead objects (the same fields are added to all), but for illustration purposes, we’ll focus on the Account rollup reporting here.
Once Eloqua is up and running with activity synchs to SFDC and you have installed and configured Eloqua Discover for Salesforce.com, you can go to create a new report.
To create the reports shown above, you will want to create a Accounts & Contacts report, then base it on Accounts.
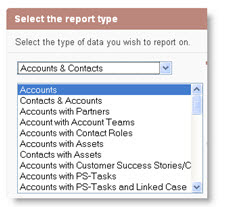
Select the type of report you want (e.g., Summary) and then when you get to the Standard Summary Fields interface, scroll down and you will note additional fields that have been added to the Account object by the Discover application:

Opt to Sum any of the fields on which you want to report – in this case, we have used Total Buy Signals and Total Open Opportunities (we are using Total Open Opps so that we can filter out Accounts that do not have at least one open opportunity).
Depending on how you want to group the data (e.g., You are interested in seeing, by region, WHICH ACCOUNTS have the most Buy Signals), select the appropriate metrics. For the second graph above, we use the following grouping logic:

Then make sure that in your Columns selection, from the Account: Custom Info area, you choose the 2 new fields – Total Open Opportunities and Total Buy Signals:

Then, make sure you apply a filter that weeds out:
• Accounts linked to no open opportunities
• Accounts that aren’t showing a relatively significant amount of activity
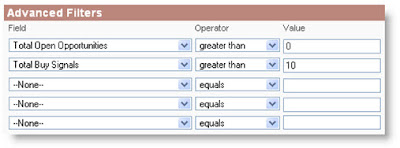
Depending how your regions are broken out, you may also want to generate several different reports only covering certain regions or certain reps (as we have done in this example), so the filters are entirely up to you and will simply dictate the breadth of data you want to cover in each overview report.
Now, you just have to put the finishing touches on your Chart. The below outlines the basic setup for the Hottest Accounts by Region report:
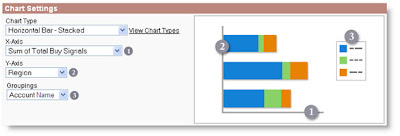
And you’re done!
Now that you can quickly whip up overview reports of your hottest Accounts, Leads and Contacts, Eloqua Discover for Salesforce.com quickly becomes an invaluable tool for not only providing your sales reps with close power but also for providing your sales management and executive team with high-level insight into which regions, reps and accounts are seeing and generating the most interest in your products.
If you’d like some general info on Eloqua Discover for Salesforce.com, please get a hold of your Customer Success Manager and/or check out http://eloquaforsales.eloqua.com/.
A question out to the readers and users – will this type of reporting prove valuable? Why? If not, what are the additional metrics and perspectives that would really drive this over the fence?
