 (Guest post from Rob Heerdegen, one of our top Product Specialists in the EMEA region)
==========================
I love reporting! I'm one of those analytical geeks who just can't help but prove how right was my assumption. Sound familiar? This will be right up your alley.
Eloqua is home to thousands of great reports. And then when you combine some of those reports with our segmentation and activity based filters, WOW, you have analytics that keep you and your marketers busy for days!
A client I work closely with in the Financial Industry here in London, UK, was eager to find different use cases for these new filters. Email deliverability is always a hot topic for them. With marketers around the world, they very much leverage Eloqua's decentralised flexibility but put in monitoring tools (proactive and reactive) to keep tabs on the health of the global marketing efforts, centrally.
Here was ONE way they could leverage these filters to be more on top of issues of email deliverability or subscription health by understanding exactly where any issues (such as a high number of bouncebacks) were taking place.
(1) Show me my Data! Building a contact view
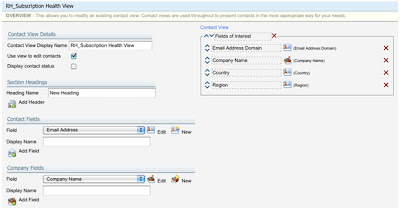
Create, or have your administrators create, a contact view, to isolate the field(s) of interest from all of your segmentation fields. See only what you want and need!

(2) Find me all my bouncebacks (or unsubscribes) in the last X days/months by Country... OR Geo region... OR etc.
Country, Geo.Region, Email Address Domain, Job Title (normalised I hope!), etc.
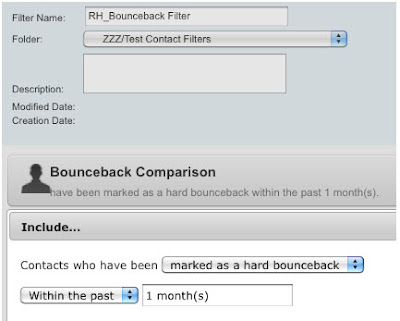
Simply create a new contact filter, with a single criteria 'Bounceback' (or Subscription) and set the time range for something practical, in the past 1 month.

(3) Build me my report!
Go to Reporting and search 'Field Completeness'. Find the report 'Contact Field Completeness by Contact Filter'.
Chose your filter, pick your view, and run!
Drill down on each of the major segments (e.g. Country, Email Domain, Region, etc.) to get the breakdown. Add these reports to a dashboard, or to an email update report!

Quick tip! Want to keep your finger on any hot leads turning cold? Copy your bounceback filter just created and add a contact segmentation field 'Lead Status' = HOT (or whatever your naming convention is) to find and be alerted instantly to any changes to email status of 'HOT' leads.


3 comments:
Rob, what was the problem that prompted you to develop this report and what was the take away from this data to fix it?
America - East Coast had a higher bounceback rate, ok so now what?
-Thanks
Thank you for your question! You raise a good point, so what if North America - East, EMEA, or APAC has a high percentage of bouncebacks?
Alone, this statistic won't tell us the whole story. However, as part of a dashboard, which includes opt ins, and unsubscribes by region, campaign, named account, your marketing team can start assessing whether their database of existing contacts are adequate enough to deliver on your marketing objectives.
For global organisations, especially, the opportunity for these 'hotspot' dashboards are keeping your centralised ops team on top of regional, localised activities. Should a region be nearing an unacceptable threshold allows your team to react and correct quicker.
NA-East, for instance, may have made list purchasing a top expenditure that quarter, which has lead to a bounceback spike, but not translated in enough opt-ins. Perhaps it's time to intervene and shift that spend to alternative services like Fresh Address or diversify their channel marketing efforts to include telemarketing / print mail alternatives to (re)engage the audience.
'Hot-spot' dashboards, generally, keep your localised team apprised of the health of their portion of the database. See the article (right below!) on 'Separating your Marketing Database' into Active/Inactive.
If NA-East is to go after a few tactical accounts or verticals next quarter, a quick review of a subscription health dashboard will indicate the state of affairs (number of subscribed contacts by company/account/domain).
Generally, I'm passionate about finding creative uses of combining filters (behavioral and/or demographic) with hot-spot dashboards. As a marketer, I love to bring to life a 'segment by…' story, easily.
e.g. show me, by opportunity stage=stuck, the number of named accounts NOT sent an email in 30 days.
-- Why are we not nurturing these contacts?
e.g. show me, by named strategic account, who has NOT responded to an email in the last 30 days
-- Why are these being excluded from our monthly newsletter?
e.g. show me, by named strategic account, who has been sent more than 30 emails in the past 30 days, etc.
-- Why are we sending so many?
Looking forward to any other specific use cases for these 'hot-spot' dashboards! Thanks again for the question. Kind regards, -Rob
Thank you, I found this very useful and interesting.
jm
Post a Comment