Showing posts with label marketing analytics. Show all posts

Wednesday, December 16, 2009

Filtering IP Addresses from Marketing Analytics


Today's post is a guest post from Leigh Oxley, Team Lead in Eloqua's product support group. She has been a part of the Eloqua Product Support team since 2006, supporting marketers in their quests for marketing automation excellence.

Based out of Eloqua’s Toronto office, she is currently focusing on high-priority initiatives to improve the support organization, as well as working directly with our partner eco-system by providing dedicated support to certified partners. Not only that, but she's great to work with, so if you want ideas, insight, or help on your next campaign, data project, or lead scoring initiative, give Leigh or her team a call, and they are always glad to help.

================================


I think we can all agree that testing is an important part of any project – ensuring that everything will work as expected from start to finish. One thing we often don’t consider though, is how the test data will affect our reporting metrics once the campaign goes live. For example, if you run an email campaign driving visitors to a brand new landing page, and you have a team of internal people testing all of the pieces, you will want each of those people to click-through from your email to the landing page. Once your campaign goes live, you will have a set of visitors who are only testers, and likely shouldn’t count towards your marketing metrics once you go live – you don’t want to report inflated numbers to your executive team!

A quick and simple way to avoid this is to setup an IP filter within the Eloqua application, so that internal IP addresses are filtered from your analytics. As a Customer Administrator-level user, you have the ability to tell Eloqua “I don’t want to see visitor reporting on anyone coming from these IP addresses” through Setup -> Management -> System Management. This will simply disable tracking for anyone who visits your site from a list of IP addresses you define so that no web visitor information will be tracked. By setting this up for your organization, you can ensure that internal testers won’t be tracked and count towards your campaign metrics.
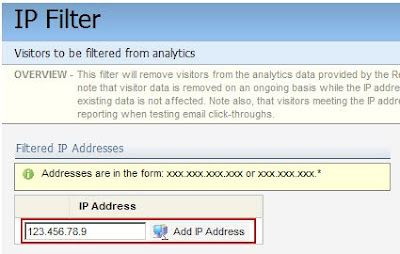

One question that clients often have when setting this up is how the functionality actually works. Essentially, when the website tracking scripts on your website pages see a visitor from an IP address you’ve configured to be filtered, they will ignore this visitor’s data. That means that if you later decide you want to track information for this IP address, you can simply remove it from the list and tracking will begin to take place. Something important to note is visitor data is removed on an ongoing basis while the IP address filter condition applies, but that existing data is not affected.

If I have a visitor profile with website visits reported from yesterday, and my IP address is added to the list today, then removed tomorrow, there will be a one-day gap in the reporting for my visitor – while I’m on the list, no web activity will be tracked. Another important point is that this does not affect other reporting for the contact, only visitor website activies are affected; all form submissions, program history, email sends, email opens, are still tracked as normal, but email click-throughs (as these are web activity) will not be tracked.

Hopefully this helps you to maximize your reporting efficiency in Eloqua and ensure you’re reporting the truest information to your teams. If you would like to set this up for your organization, there is a step-by-step interactive checklist available here in Customer Central to walk you through.

Thursday, August 27, 2009

Better Marketing Analysis Through Dynamic Filters


When you run a report within Eloqua, you will often want to understand a bit more about the data that you have within the report. Whereas you can easily export the data for secondary analysis in a tool like Excel, often the easiest thing to do is to dynamically filter the results of your report to get the view you want.

This is easy to do from most list reports (ie, a list of visitors, or a list of contacts).

In the top menu, under Filter, select "Filter these contacts" and you will be presented with a window that lets you define a filter. That filter is applied dynamically to the report you are looking at, letting you quickly see a subset of your data.

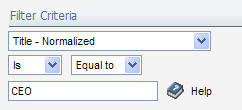
For example, if you had a list of contacts who had submitted a web form for a download, and wanted to understand how effective that marketing campaign had been at targeting CEOs, you might add a filter for "Title = CEO". Note, however, that the need for a contact washing machine becomes very clear in doing this. If we have not managed the data quality of our incoming title data, it will be hard to define a good filter. However, if the data has been standardized and normalized, we can work with a normalized Title field that can be easily filtered.

With the "CEO" filter layered on to our results, we can quickly see whether the campaign has been effective at generating responses from top execs. The filters can be quickly and easily removed or changed, which lets you work with any list report to get a better sense for the data it contains.

Dynamic filters on reports are a quick but powerful tool for getting better insights out of your marketing data.


Tuesday, July 21, 2009

Marketing Analysis and the Lead Funnel


In thinking about B2B marketing analysis from the perspective of a top-down view of a balance sheet and income statement of lead metrics means that we need to look at the stages of the buying funnel a bit more objectively. A balance sheet view would give us a current (or past) point in time view of what leads are at what stage, and an income statement view would give us an indication of the transitions in stage that took place within the time period.


The first step is to define the stages of your buying process more explicitly. This can be as simple as the Sirius Decisions model of Inquiries and Marketing Qualified Leads, or it can be a unique mapping of the buying process stages of your business. The number of stages in your buying funnel will depend on your business and how your buyers buy.


With the stages defined, however, you can then begin to model them as part of your marketing analysis. Within Eloqua, this means defining the lead stages/ranks. In Campaigns, under "Inquiries & Leads", select "Lead Ranking Systems". You can define a lead ranking system to model your buyers buying process as you need.


Each leve you define has an order, a name, and a text value. The text value is what is written to the underlying contact or prospect when a lead is defined as being in this stage.


To indicate that a contact or a prospect is a lead at a certain stage of the buying process, you must build a lead ranking rule. Under Data Tools, build a lead ranking rule for each stage in your buying process.


With that in place, you can use a lead ranking rule whenever you want to define that a lead is at a particular stage. The text value for the lead rank/stage is written into the contact record, so existing processes that may be dependant on seeing data in the contact record are unimpacted.


The lead ranking rules can be run anywhere it might make sense; on groups that have been uploaded, such as lists from events or tradeshows, in form processing steps to indicate that anyone submitting a certain form is at a certain stage of the buying process, or within program builder.

Running a lead ranking rule from within program builder is done in a similar manner to how leads were ranked as being a certain stage using data update rules. Except that when done within a lead ranking system, the lead rank is stored historically, and forms a basis for all of your marketing funnel analysis.


With your lead funnel data flowing through as formal lead ranks, you will be able to easily represent it in funnel reports in the campaign analysis area. More importantly, when it is tracked in this way, a historical record of the lead rank for each person is kept. This allows you to view how each person's lead rank has changed over time, and begin to understand how your marketing campaigns have facilitated moving buyers through the lead funnel.


(*Please note that the capabilities described here are currently available only with Eloqua Team edition)

Thursday, June 18, 2009

Marketing Dashboards and Time Ranges - A Quick Tip


I use custom dashboards a lot in Eloqua, usually in order to track ther performance of anything I'm interested in over an extended period of time. The performance of the Eloqua Artisan and Digital Body Language blogs are good examples of that - I check in on their performance using a custom dashboard at least a few times per week. We also track in great detail what the sources of traffic are for our online properties in another custom dashboard.


When building and using custom dashboards, one setting that is worth being aware of, and thinking about, is the time range settings. This is the definition of exactly what period of time is included in the dashboard. With Eloqua, you have a rich set of options that you can use to define exactly what timeframe you have in mind.


You can configure this for the standard dashboards in your system in one central place, under Setup->Management->Systems Management->Dashboard Settings, or you can configure the settings for each report in a custom dashboard by selecting Edit under the Actions menu on the report's upper right side.


Each of these will give you a set of time range options. For a dashboard, it's almost certain you will be using a relative range (the period of time up until now) rather than a fixed range (a specific set of days) as you generally want the dashboard to change over time and be up to the current moment.


However, that's where the nuances come in. If you are looking at a daily chart for the last 3 weeks, for example, exactly how you specify that will guide how your data appears for the periods around the start and end of the time period.


For example, if we looked at it literally, we could say that the last three weeks was equal to the last 3x7x24 hours. However, the data for the day at the start (three weeks ago) and the day at the end (today) would be skewed based on the time of day we looked at. If I looked at that data at 6pm, the starting day would only have 6 hours of data in it and the ending day (today) would only have 18 hours of data in it (up until 6pm). In many cases, this literal option is not the best result.


The "Last Full X days/weeks/months" options provide a way around this, by only including full days. There is also an option to "include today" with these if you do want to show the 18 hours of data up until the current moment in the day today, without skewing the data on the start day.


Similarly, a variety of options allow you to report on specific precisions at the week or month level (such as weekdays only, for example), if that is relevant to your marketing analysis.


What is important is that you think carefully about exactly what period of time is of interest to you and then select that option for your dashboards. The options will be available to you to do what you need.


Thursday, April 23, 2009

Account Selling using an Activity Summary Report in Salesforce.com


In B2B marketing and selling, we are managing a delicate balance between selling to individuals and selling to the organizations they serve. At the end of the day, we are doing both, and being able to aggregate individual activities into an overall "radar" that helps us sell into an account is extremely valuable.

This is very easy with Eloqua, and you can present the account selling summary reports directly in your sales team's CRM system. With activity logging set up, you will be able to configure it quickly using your CRM system's reporting engine (in this example Salesforce.com).

What we'll be doing is creating a custom report that shows the response that people at each account have had to your marketing, rolled up by account, but showing the individuals and their activity.

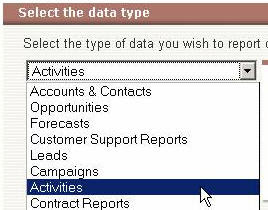
First, create a New Custom Report in Salesforce.com under the Reports tab. You will be asked what you would like to report on, and select "Activities", followed by "Activities with Contacts" as we'll be looking to see, and aggregate, the activities performed by contacts in each account.

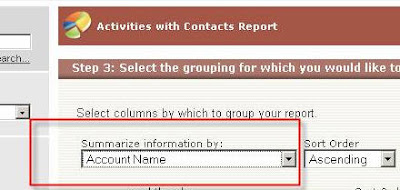
When you are asked what type of report you would like to create, select a Summary report as this will allow us to aggregate our data by account. To do this, when asked, choose to summarize the information by Account Name.

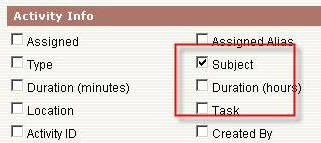
In the next step, we'll be asked to select which columns are of interest. There are a number that are critical for this exercise, and a number that are optional. Select "Subject" under Activity Info, as we'll use this field to determine whether the activity is an outbound marketing activity or a response.

Select Account Owner and Account Name, as these are the fields that will allow us to show this account radar based on an individual sales rep's accounts, and of course the Account Name field is what we are using to roll up the activities.

Similarly, we can select Contact Owner, First Name, and Last Name, under primary contact info, as this will allow us to see who the individual is who showed activity. We will also usually select Email, and perhaps Phone from the contact's connection information as this will make the final report more actionable.


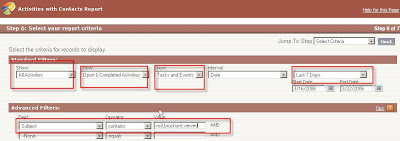
The next step is the criteria. You will want to define a timeframe, such as "All Activities" that have been "Open & Completed" in the "Last 7 Days" to keep things recent and relevant.

In order to ensure that you only see inbound/response activities, rather than all marketing activities, you will want to add a filter on the Subject field. Add a "Contains" criteria, and type "visit,brochure,viewed" in the Value field to limit this report to only the activities of interest.

You can also add criteria to limit this report only to a specific sales rep, or a specific territory if you are interested at this point.

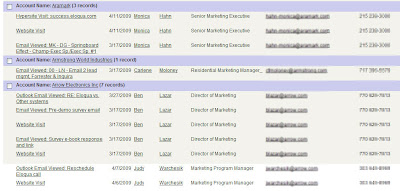
With this completed, you are ready to save and run the report. Click the image to the left to see what a final account radar report looks like.

This is a very useful report to construct for each of your field sales team members as it gives them an instantaneous view into their accounts, and they can see which of those accounts are showing buying activity.

Friday, April 17, 2009

Closed Loop Reporting with Salesforce.com Campaigns


If you use a CRM system such as Salesforce.com, you can easily use Eloqua to map inquiries to campaigns, and from there understand the return on investment that the individual campaign produced. This gives you a quick and very useful approach to closed loop reporting in your marketing campaigns.

This works well in less complex buying cycles where a single campaign can reasonably be tied to a single purchase event. In those cases, tying the inquiries from a form or a landing page to a campaign in CRM, and using that tie to understang campaign effectiveness is all you need to do. In more complex buying cycles where you want to understand the influence of multiple campaigns over multiple months, you'll want to use Eloqua's campaign analytics module.

For the simpler case, however, it's easy to get started. I'll show an example with Salesforce.com campaigns, but this can just as easily be done using Oracle's Siebel on Demand product or Microsoft Dynamics CRM.

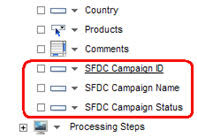
First, we'll add the key fields for the campaign to the form. They do not have to appear in the HTML of the form for the web visitor, but by adding them to Eloqua, we can then associate that form with the right campaign in Salesforce.com. Add a field for each of SFDC Campaign ID, SFDC Campaign Name, and SFDC Campaign Status.

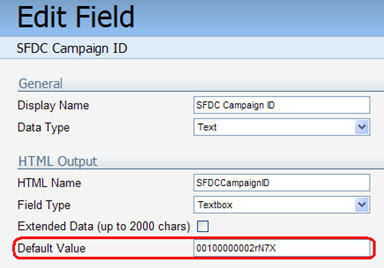
With each field, edit the field properties by clicking on the field, and populate the values you require for each of the three fields. The campaign ID, for example can easily be discovered in Salesforce.com in the address bar of your browser when you have selected the campaign you are interested in associating leads with.

With that in place, you can then add the campaign information to the contact's record, so you can see at a glance what the last marketing campaign was that they were associcated with. This information is valuable to have associated with them for various analysis and reporting purposes, but we'll just use it for now to associate their record in Salesforce.com with the appropriate campaign.
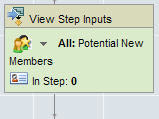
To update the contact record, simply add the three fields we have been workding with to your update contact step as optional parameters. This will add the campaign information to the contact record within Eloqua.
With the information added to the contact record within Eloqua, and assuming that your CRM integration with Salesforce.com is set up normally, the only remaining step is to add this contact to your CRM update program.
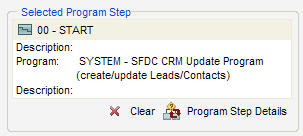
Add a form processing step to add the contact to a step in program builder, and select the System program for running the CRM update. Unless you have configured this program from the default, this will automatically pick up the values of those fields in the contact record, and make the necessary associations with the campaigns in Salesforce.com.
As you know, your business, and your CRM system configuration, guides you towards many potential ways to define how and when contacts and leads are associated with your Campaigns. Rather than be forced into a one-size-fits-all approach, by opening up how forms are linked with campaign data, how that is written into the contact record, and then how that contact is mapped to the CRM system, you should find that the resulting structure best maps to your business needs.
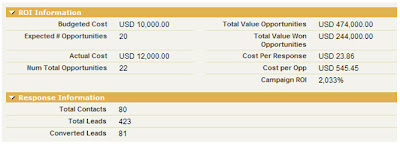
With the mapping in place, you can now see very quickly and easily which campaigns are performing, which are creating opportunities, which are driving revenue, and which have the highest overall performance in terms of marketing ROI.


Wednesday, March 18, 2009

Understanding Traffic Sources


In a couple of posts recently, I have talked about setting up online referrer campaigns to track where your traffic is coming from, and then how to look at individual web visitors and understand where they were last referred from.

This data is also very interesting looked at in aggregate in order to understand which of your online sources are driving the most traffic. To do this in Eloqua is quick and simple. In the web profiling -> Referrers area, choose the channel (such as Online Media) that you want to understand better and select the "View Marketing Campaign Breakdown" option. This will show you all of the campaigns you have configured under that channel, and give you a breakdown of those campaigns by the traffic that they have sourced.


The resulting report, of course, can be added to email updates or custom dashboards, to give you an ongoing sense of where your traffic is coming from. In our case, for example, we learned that our discussions on Twitter were sourcing more traffic than we had anticipated (although yes, the data to the left has been slightly disguised...).

By setting up tracking for relevant blogs that have high profile links to your site, you can gain an understanding of whether those references are driving traffic, and how much. In our case, I learned that Valeria Maltoni's Conversation Agent, Adam Needles Propelling Brands, and Jep Castelein's Lead Sloth were interesting sources of traffic to Digital Body Language recently.

Monday, March 16, 2009

Most Recent Campaigns as Source of Insight


I wrote recently about setting up Online Media referrer campaigns to track where your visitors are coming from. It's a simple but powerful technique in Eloqua to give you better insight into what sites are driving traffic your way.


This is equally valuable though, when looked at from the other direction. For each visitor on your website, you can see what the most recent referral campaign was that drove them to your site. With the tracking already set up, all we have to do is add that as a field to their visitor profile view.


Under the web profiling area, edit the profile view you want to show the most recent referrer campaign. Under profile fields, you should see an option for "most recent marketing campaign". Add that field to the appropriate spot in your profile view. You will also see similar fields for most recent search query, most recent channel, etc. All of these can be used in a similar manner, and can provide some very interesting insight into online media sources, blogs, and even Twitter.


With that in place, now when you use that Profile View for your reports, you will have columns that show the most recent online referral campaigns that drove each visitor to your site. Presenting this information in your visitor reports, especially those going out to your sales team can provide very important information as part of the prospect's digital body language.


Wednesday, March 11, 2009

Social Media Tracking - Inbound Referrals


As social media becomes an increasingly relevant environment in which your prospective buyers learn about your industry or your solutions, you need a way to understand its influence from a marketing perspective. Luckily, this is easy to do in Eloqua, you can use Referrer Tracking to track which blogs are sending visitors your way.

To give you an idea of how we can do this, I’ll use an actual example from the Digital Body Language blog. Valeria Maltoni on Conversation Agent referred to the Digital Body Language blog in a post on her site. That post began driving traffic, and I wanted to understand what that traffic was looking like.

In this case, Valeria had been kind enough to insert a custom tracking query string (more on that later as it opens up some interesting options), but in most cases you won't have that, so we'll set up referrer tracking assuming that custom tracking query string wasn't there.

To set it up, I went to the Web Profiling -> Referrers area and created a new Online Media campaign. These track external campaigns based on two main things, the referring URL and the landing URL. I set this up so that any visitors to any Eloqua web property (the Digital Body Language blog is tracked as part of the overall set of Eloqua web properties) that came from Conversation Agent would be marked as being part of this referrer campaign for reporting purposes.

This was done by adding the Conversation Agent URL as a referring URL, and leaving the landing URL blank. By checking the box to check for past website activity, anyone visiting from this referral recently would automatically be added. Given that we often don't know in advance of a referral in social media, and the traffic spike will happen within a day or two, this is a very useful ability.

To see which visitors came to the blog from Conversation Agent, all we have to do is select the “View Marketing Campaign Visitors” menu item, and we’ll see a list of the visitors that came from Valeria’s referral link.

What we’ve done for tracking a referring blog as an online referral source can be done with any similar online source. If the referring site, landing URL, or both, are known, you can easily define that as an online referral source and quickly and easily understand which of your visitors have been referred via that source, without the need for custom links and query strings.

We've used this internally for any campaigns that drive traffic to our site, whether from blogs, industry analysts, or news. It provides a great perspective on where each individual is coming from, and traffic patterns in general.

Friday, March 6, 2009

Marketing Source Codes and Display Maps


One of the challenges with setting up source codes for tracking interest that comes from a variety of sources is that you end up reporting on the "code", which is often not intuitive to the reader.

To make this a lot easier, within Eloqua, you can set up Display Lookups to allow to to track the codes in their raw form, while displaying a more intuitive, readable source to the person reading your reports.

In the Web Profiling -> Query Strings tab, when you are setting up a query string to be tracked, at the bottom of the page, there is a line for Display Maps. A Display Map is a very simple thing - it takes a list of your raw "codes", what shows up in the actual query string, and it maps them into something more friendly to display.

By clicking "New", you can create a Display Map that fits the codes you are using. If the code does not exist in the Display Map, you will just see the original code rather than the mapped value, so there's no issue with a less-than-perfect mapping.

Once you have the codes and values mapped, you are all set. From here, report on your query strings, the way you normally would, and the values that are presented will come from your Display Map rather than the raw codes. A much more presentable way to show the data.

For example, here is the basic Query String Values report, and you can see that it now shows the values rather than the original codes.


Wednesday, March 4, 2009

Email Analysis By Region - Batch Overview by Group


If you are running a marketing operation that is larger than one region, you'll likely want to be able to split your analysis by region. Even very useful reports such as the email batch overview report become too busy to be useful with a large marketing group sending many batches per day.

Many of these high level reports can be broken down by region in one or more ways.

One of the easiest ways to break down the "email batch overview" report, for example is to use the "email batch overview by security group" report instead. This presents the same information, but is done based on the security group of the sending person.

If you have existing groups of marketers that suit your purposes, you can use them, or if not, you can create these groups.

Defining groups based on "marketers in France" vs "marketers in Germany" allows you to split your reporting along geographic lines, while defining groups based on "marketers targeting SMB" vs "marketers targeting Enterprise" allows you to split your reporting based on market focus.

Once you have selected your group, you can run the report and see the email batch overview based on that group of marketers. This report can be added to a custom dashboard or an email update as you require.

Wednesday, February 25, 2009

Dynamic Dashboards with Groups and Programs


I wrote a little while ago about using Group Manipulation to set up very customized reports that show interesting cuts of your data. We used the combination of Activity-Based Filters and normal Contact Filters to find a list of Executives (Director, VP, CxO) who had shown a minimum level of web activity/interest in the last month. This was just an introductory example of the technique of using Group Manipulation to find, and report on, almost any cut or slice of your marketing data.

I was chatting with Nate Pruitt the other day who is a very smart Eloqua user, and VP Marketing at Asure software, and we were discussing the next level of this technique. How do you make a continuously update dashboard of this data rather than manually manipulating Groups to perform the analysis once.

The good news is that this is also easy to do. The overall philosophy is the same, using Contact Groups and multiple steps to perform the analysis and create the right set of members in a Group. However, instead of doing this just once, manually, we'll use Program Builder to perform the manipulation of Group members.

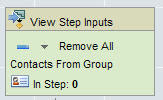
Step 1 is removing existing members from the Group in order to start from zero. This is simple, we'll just add a Program Step that removes Contacts from a Contact Group (our "Interested Exec" Group), and use the Group itself as a Feeder for that step in the Program. This lets us automatically empty the Group each time we start the process.

Next, we'll use our original Activity-Based Filter to feed the Program with any Contacts who have shown Web Activity of a certain amount in the last month. The rule for that is all built into the filter, so all we have to do is set up a Program Feeder to pull those members in on a daily basis.

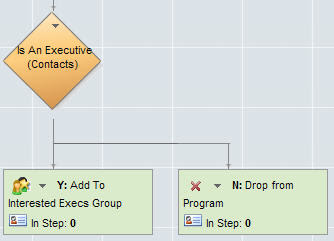
Now we have members in the program who are showing the right level of activity, but we're not sure if they are Execs. In the static example we used a Group/Filter combination to determine this, but since we have the active contacts in a Program already, all we need to do is apply a Filter through a Decision Rule.

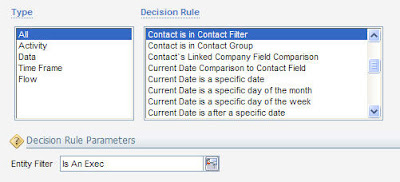
The Decision Rule will use our pre-existing "Is An Exec" Filter that looks for the appropriate titles, and uses a wildcard search to include execs from any line of business (sales, marketing, finance, etc).

Use the "Contact Is In Contact Filter" Decision Rule and select the existing Filter, and the Contacts flowing through the Program will be split based on whether they are in an executive role or not.

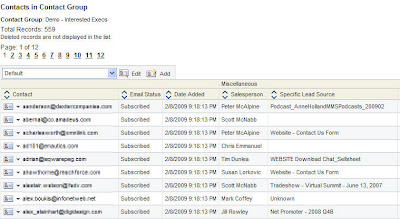
For those who are executives, one final step adds them into the "Interested Execs" Group, and for those who are not, we can just drop them from the Program. Now we have a continually updating list of executives who have shown a minimum level of web interest in the last month.

This is an ideal situation for creating a custom dashboard that shows the members of the group and can be accessed at a glance. It is also a general technique that can prove very valuable in tackling all sorts of interesting analysis and dashboard challenges.


I look forward to your comments on how you have applied this technique in your marketing analysis.

Monday, February 16, 2009

New Ways To Think About Reporting - Group Manipulation


One of the most common reports we all want as Eloqua users is a list of Contacts where X and Y are true. It may be as simple as the list of people registered for the next event, or as complex as the list of East coast execs in manufacturing companies who have shown interest in the last month.

The good thing is that whether it is simple or complex, you can usually create the list quickly and easily. For the more complex requests though, the best place to start is with the manipulation of a Contact Group. Rather than trying to create one report that will provide exactly the set of Contacts you want to include or exclude in your report, start with a Contact Group.

For example, if we want to create a report that lists executive level contacts (VP, Director, or C-level) in any field who have show web activity in the last month, it would be a difficult report to put together. However, it is simple to put this report together with some group manipulation.

The reason this is an easier path is that you can break a complex report into steps, and deal with each step on its own. For this example, we'll start by creating a Group of we'll call "Interested - All". Using the "Add Contacts" option allows us to add Contacts to that Group, and we'll use a Filter to add them.

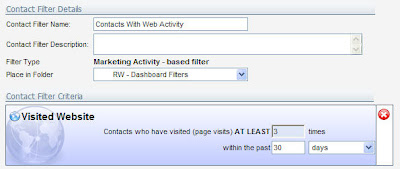
As the second step in our process, we'll create an Activity-Based Filter that identifies all Contacts who have had web activity (let's say greater than 3 visits) in the last month. Selecting this Filter in the Add Contacts step now gives us a Group with all Contacts who have shown web activity.

For the next step, we'll create a Filter that is called "Is An Executive" that uses wild cards to look for "*Vice Pres*" or "*Director*" or "C*O".

In a third, and final step, we'll create a second Group, "Interested Executives" and choose the "Add Contacts" option again. This time we'll use the "Contact Filter and Contact Group" option, and choose our "Is An Exec" Filter and our "Interested - All" Group.

Running this now adds all the Contacts who are executives and have also shown web interest.

From here, the reporting is simple, as you can use the regular reporting available on Contact Groups to provide you with lists, data profiles, or geographic views of the interested execs.

This example is a simple one, but it gives you a new technique that you can use in creating the right slice of your marketing database. By breaking it up into separate steps, and using the filtering, overlap, and activity-based tools available to you, you will find that a lot of new analysis options become possible.

In the next post on this general topic, we'll look at making this whole concept dynamic and continually updating: http://eloqua.blogspot.com/2009/02/dynamic-dashboards-with-groups-and.html