 The good thing is that whether it is simple or complex, you can usually create the list quickly and easily. For the more complex requests though, the best place to start is with the manipulation of a Contact Group. Rather than trying to create one report that will provide exactly the set of Contacts you want to include or exclude in your report, start with a Contact Group.
For example, if we want to create a report that lists executive level contacts (VP, Director, or C-level) in any field who have show web activity in the last month, it would be a difficult report to put together. However, it is simple to put this report together with some group manipulation.
 The reason this is an easier path is that you can break a complex report into steps, and deal with each step on its own. For this example, we'll start by creating a Group of we'll call "Interested - All". Using the "Add Contacts" option allows us to add Contacts to that Group, and we'll use a Filter to add them.
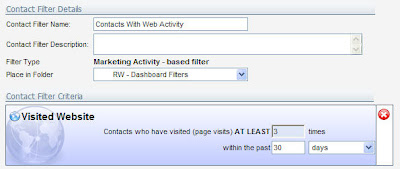
As the second step in our process, we'll create an Activity-Based Filter that identifies all Contacts who have had web activity (let's say greater than 3 visits) in the last month. Selecting this Filter in the Add Contacts step now gives us a Group with all Contacts who have shown web activity.
 For the next step, we'll create a Filter that is called "Is An Executive" that uses wild cards to look for "*Vice Pres*" or "*Director*" or "C*O".
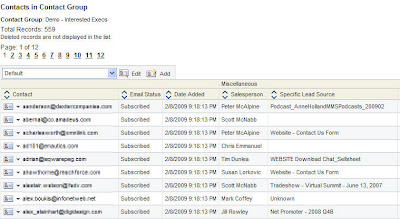
In a third, and final step, we'll create a second Group, "Interested Executives" and choose the "Add Contacts" option again. This time we'll use the "Contact Filter and Contact Group" option, and choose our "Is An Exec" Filter and our "Interested - All" Group.
Running this now adds all the Contacts who are executives and have also shown web interest.
 From here, the reporting is simple, as you can use the regular reporting available on Contact Groups to provide you with lists, data profiles, or geographic views of the interested execs.
This example is a simple one, but it gives you a new technique that you can use in creating the right slice of your marketing database. By breaking it up into separate steps, and using the filtering, overlap, and activity-based tools available to you, you will find that a lot of new analysis options become possible.
In the next post on this general topic, we'll look at making this whole concept dynamic and continually updating: http://eloqua.blogspot.com/2009/02/dynamic-dashboards-with-groups-and.html


2 comments:
Steven,
This is pretty useful. Any way of working purely with filters? Groups are a static entity and reports will get outdated pretty quickly.
If there's a way to manipulate and run filters on filters that would be very powerful.
Thanks
Amit
Amit,
Great question - it was in the next week's post http://eloqua.blogspot.com/2009/02/dynamic-dashboards-with-groups-and.html which talked about building this all dynamically. I didn't link forward to it, but that's a great thought, I'll do that now.
Post a Comment